Methods
PON Benchmark
Copyright (C) 2011 Jennifer D. Warrender, Newcastle Univeristy
Matthews Correlation Coefficient (MCC) looks at the true predictions as well as the false predictions and is also known for balancing the number of neutral predictions and pathogenic predictions. The MCC returns a value between -1 and +1. A coefficient of +1 means that the predictions are 100% correct, while a coefficient of 0 is average where 50% are correct and 50% are incorrect and lastly a coefficient of -1 is poor prediction as 100% of the predictions would be wrong.
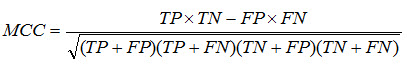
The MCC can be calculated using the formula:
where TP is the number of true pathogenic predictions, FN is the number of false neutral predictions, TN is the number of true neutral predictions and FP is the number of false pathogenic predictions (Baldi, et al., 2000; Tian, et al., 2007).
In addition to calculating the MCC, it is also interesting to look at other parameters, specifically the PM% (percentage of predicted mutations).
Optimization of parameters for the assessment of Unclassified Disease Gene Sequence Variants