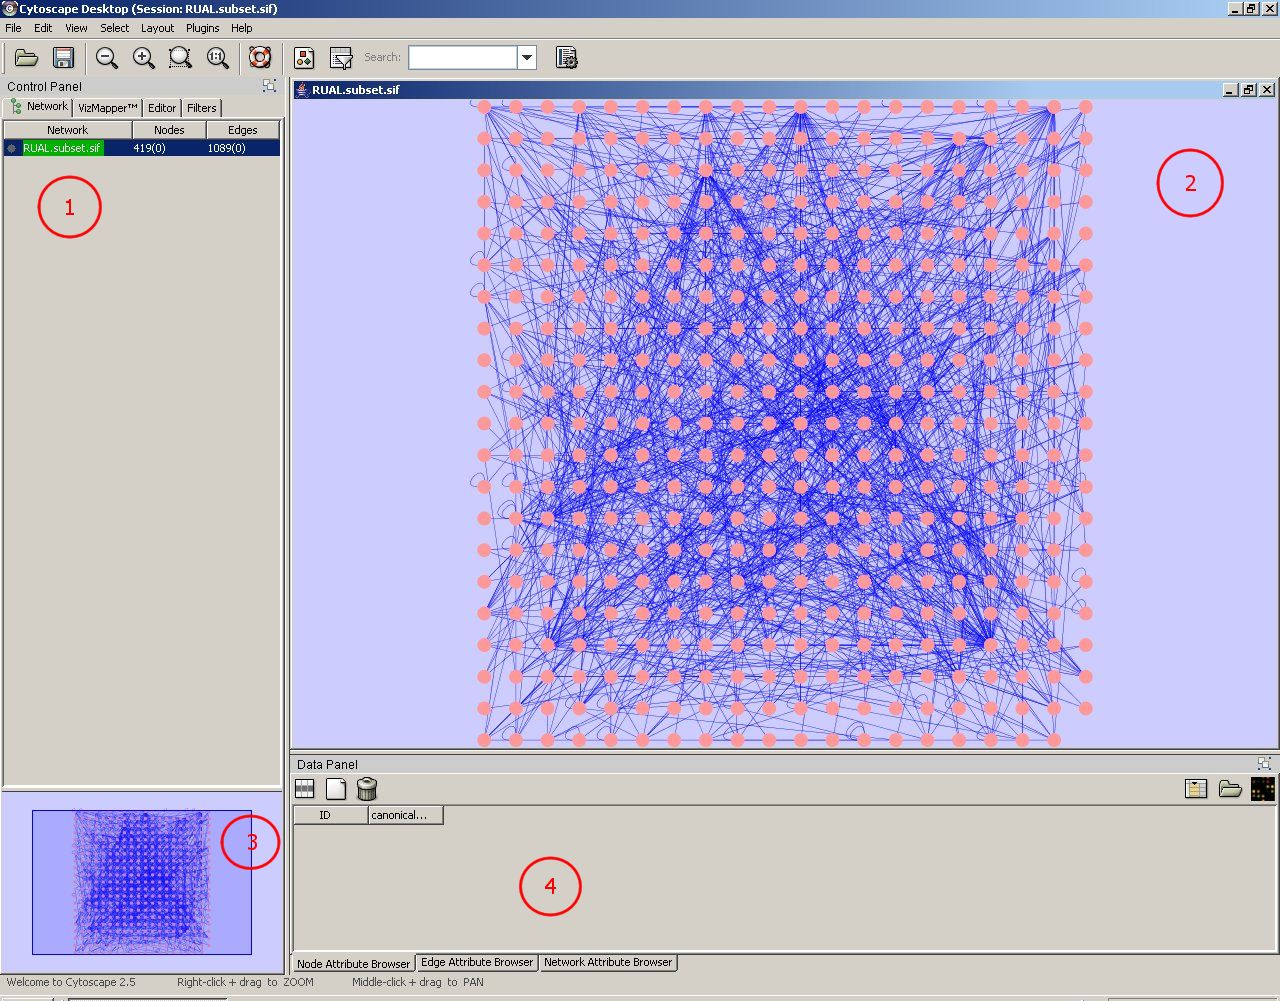

This is how cytoscape should look once you have loaded in the example data. 1. The Control Panel - has a number of tabs. The Network tab allows you to switch between networks. VizMapper lets you change the look and feel of the current network. 2. The Network View. 3. Network Preview, allows you to see what of the current netowrk is displayed in the Network View (the dark blue box). 4. Data Panel. Clicking on a node displays its attributes here. Edge and Network attributes are also available (via the tabs at the bottom of the panel.