Guide
DfEdu is designed to find and present statistics to you in a simple process. The following will detail the steps required to take advantage of all the features DfEdu has to offer. It is expected to have an internet connection, portrait and landscape enabled and Android versions 7 (Nougat) or higher for the guide to work.
Creating Graphs
1.) Select View Filtered Data
Tap the top button labelled "View filtered data" to begin selecting data.
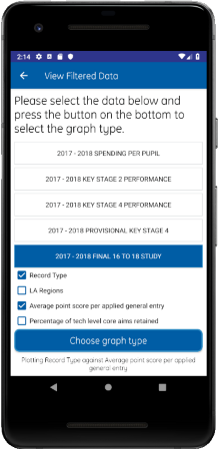
2.) Data Filtering
Select the data you want to view from the list and then select the two data types to be displayed on the graph. Tap the "Choose graph type" button to continue.
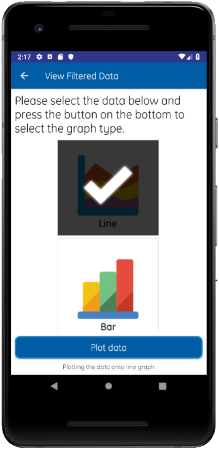
3.) Plot Chart
Now select the type of chart you want to view the data on from a list of Line, Bar and Scatter graphs. Once selected, tap the "Plot data" button to continue.
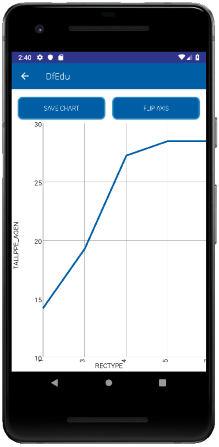
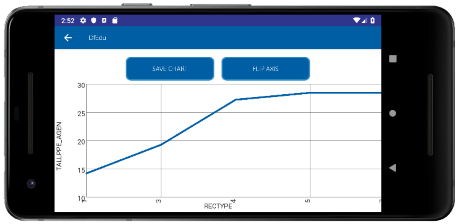
4.) Line Chart
A graph will be generated based on the chosen type. Above is an example of a Line chart. You have the option to flip the axis using the button top right if you want an alternative view of the data.
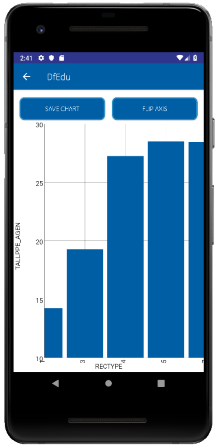
5.) Bar Chart
A graph will be generated based on the chosen type. Above is an example of a Bar chart. You have the option to flip the axis using the button top right if you want an alternative view of the data.
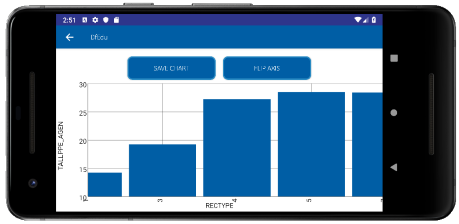
6.) Landscape View
For better viewing, you can rotate the phone landscape and the graphs will reload to fit the screen.
Geographical View
1.) Select Geographical View
Tap the middle button labelled "Geographical view" to enter map view for all schools in England.
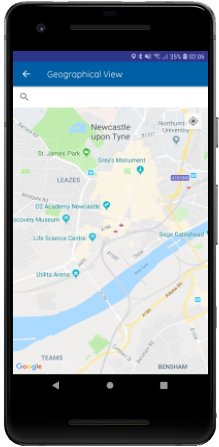
2.) Zoom into the Area with the Schools you want to View
Navigate to the area you want to view by zooming in and dragging. Additionally you can locate your current position using the top right icon and face north with the top left icon.
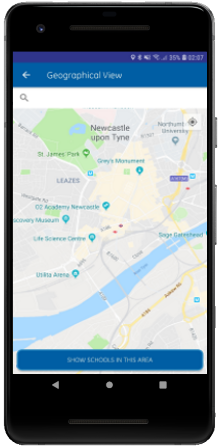
3.) Tap the Screen to Display the Show Schools In This Area Button
Tapping the screen once will display a button to display markers for schools in the area you are viewing. Tapping again removes the button prompt.
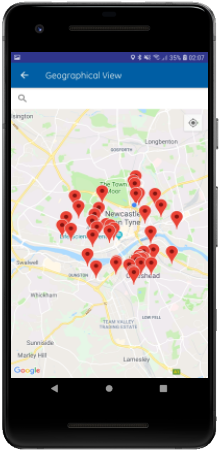
4.) Tap the Button to Display Local School Markers
Once the button has been pressed, the map will refocus to display a set amount of local schools in the area.
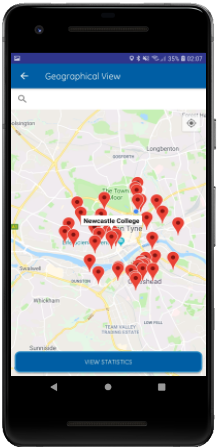
5.) Tap the Marker for a School to Display the View Statistics Button
Select a marker with the school you want to view and a "View Statistics" button will appear in the location of the last.
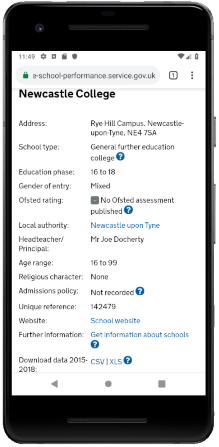
6.) Example Result
Selecting the "View Statistics" button will proceed to redirect you to the goverment website with the desired information.
How to Favourite
1.) Select Save Chart
When you have found a chart you want to save to view later, click the "Save Chart" button located at the top center of the screen.
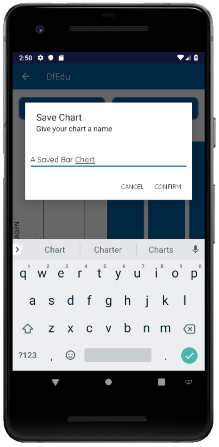
2.) Name Chart
Pressing this button will display a chatbot to name the graph and will save the chart to your device.
How to Access Favourites
1.) Select Favourite Charts
Tap the bottom center button labelled "Favourite charts" to access saved charts.
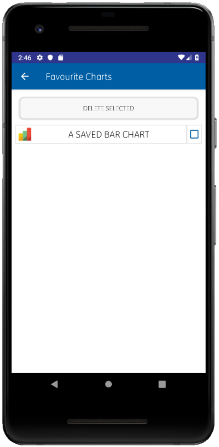
2.) Select Chart to Load
To open the chart, tap the saved chart of your choosing.
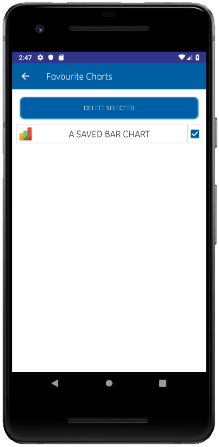
3.) Select Chart Tickbox to Delete
To remove saved charts, tap the checkbox on the right of the chart title and tap "Delete Selected".
Using the Chat Bot
1.) Select the Chat Icon
Tap the bottom right most icon with three dots and a circle shape. This will open the Chat Bot.
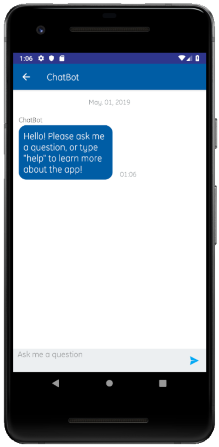
2.) Write a Problem
Tap the bottom line to open your device's keyboard. Write anything you are having trouble with and enter using the right arrow.
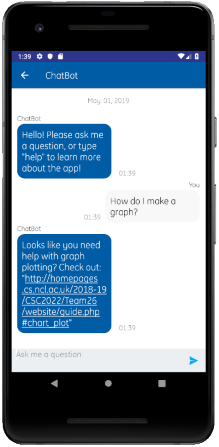
3.) Recieve a Reply
The Bot will reply automatically and provide the appropiate response to direct you to the most helpful source.
Searching Data
1.) Select the Search Icon
Tap the search icon at the top right corner of your screen to open your device's keyboard. Write the keywords for the data you are looking for and enter.
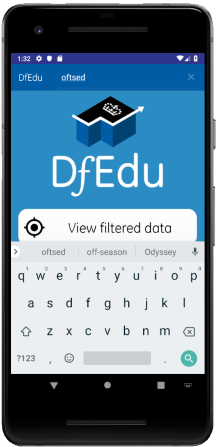
2.) Type your Query
The query used will search for any data in the Gov.uk website and return any entry with the related words.
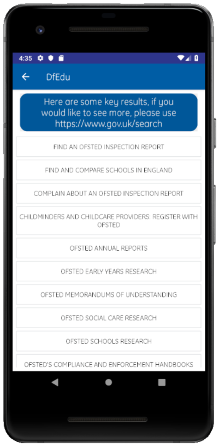
3.) Select the Relevant Data Result
If the keywords matched any existing data, there will be a list of entries to select from, otherwise the data you are looking for does not exist.
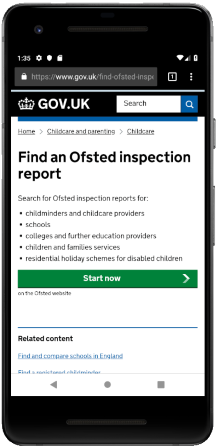
4.) Data is Displayed
Selecting a data entry will open the Gov.uk website with the data selected.